
Table of Contents
Overview
I have a docker server so I want to setup monitoring for my docker containers. I tried grafana before but didn’t like the stack much. I love dozzle but it lacks persistence. So, I tried vector & victorialogs and the combo worked quite well so far.
The setup
I only need two files: vector.yaml
sources:
  docker_logs:
    type: docker_logs
    exclude_containers: ["victorialogs", "vector"]
sinks:
  vlogs:
    type: "http"
    inputs: ["docker_logs"]
    # We add a query parameter to tell VictoriaLogs which fields to use as "streams"
    # This makes searching by container name much faster.
    uri: http://victorialogs:9428/insert/jsonline?_stream_fields=host,container_name&_msg_field=message&_time_field=timestamp
    compression: "gzip"
    encoding:
      codec: json
    framing:
      method: newline_delimited
    healthcheck:
      enabled: false
The docker compose file
services:
  victorialogs:
    image: victoriametrics/victoria-logs
    container_name: victorialogs
    volumes:
      - ./vlogs-data:/victoria-logs-data
    command:
      - "-storageDataPath=/victoria-logs-data"
      - "-retentionPeriod=14d" # Keep logs for 14 days
#      - "-httpListenAddr=:9428"
      - "-defaultMsgValue=empty" # Fallback so logs aren't dropped
    restart: always
    networks:
      - sso-net

  vector:
    image: timberio/vector:latest-alpine
    container_name: vector
    volumes:
      - ./vector.yaml:/etc/vector/vector.yaml:ro
      - /var/run/docker.sock:/var/run/docker.sock:ro
    depends_on:
      - victorialogs
    restart: always
    networks:
      - sso-net

networks:
  sso-net:
    external: true
And that’s it! Docker compose up and you are done
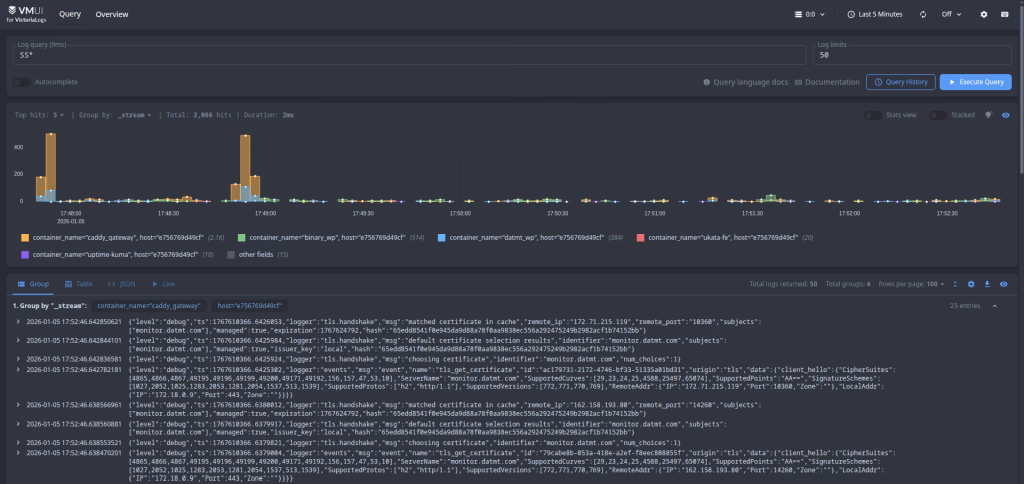
The UI
Here is the UI
Resource consumptions:

About 300 MB for the stack. I don’t say this is lightweight but acceptable for my use cases.
Conclusion
The setup is quite straight forward. The query is good. I will need to monitor this for a while to be sure how much resources it really consumes on my server under high loads.

I build softwares that solve problems. I also love writing/documenting things I learn/want to learn.