
Table of Contents
Goal: Build a small Java app with intentional performance problems, and use real-world tools to analyze and understand:
- Garbage Collection (GC) behavior
- Thread issues and deadlocks
- Profiling and bottleneck detection with Java Flight Recorder (JFR)
Step 1: Set Up a Java App with a Memory Leak
What’s a memory leak in Java?
In Java, memory leaks occur when objects are unintentionally kept in memory because they’re still referenced, preventing the Garbage Collector (GC) from reclaiming them.
Sample Code
import java.util.*;

public class MemoryLeakDemo {
    static List<byte[]> memoryLeak = new ArrayList<>();
    public static void main(String[] args) throws InterruptedException {
        while (true) {
            memoryLeak.add(new byte[1024 * 1024]); // allocate 1MB chunks
            Thread.sleep(100); // wait 100ms
        }
    }
}
Compile and Run
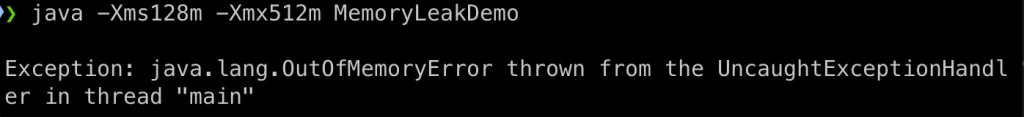
javac MemoryLeakDemo.java
java -Xms128m -Xmx512m MemoryLeakDemo
| Flag | Description |
|---|---|
-Xms128m | Start with 24MB heap |
-Xmx512m | Limit max heap to 64MB |
After a while (less than 1 minute), you can observe the app crashes due to OOM:
Step 2: Observe and Tune GC Behavior
Why enable GC logs?
GC logs show how often garbage collection runs, how much memory is reclaimed (or not), and whether your app pauses due to GC activity.
🔍 Basic GC Logging
java -Xms128m -Xmx512m \
     -XX:+UseG1GC \
     "-Xlog:gc*" \
     MemoryLeakDemo
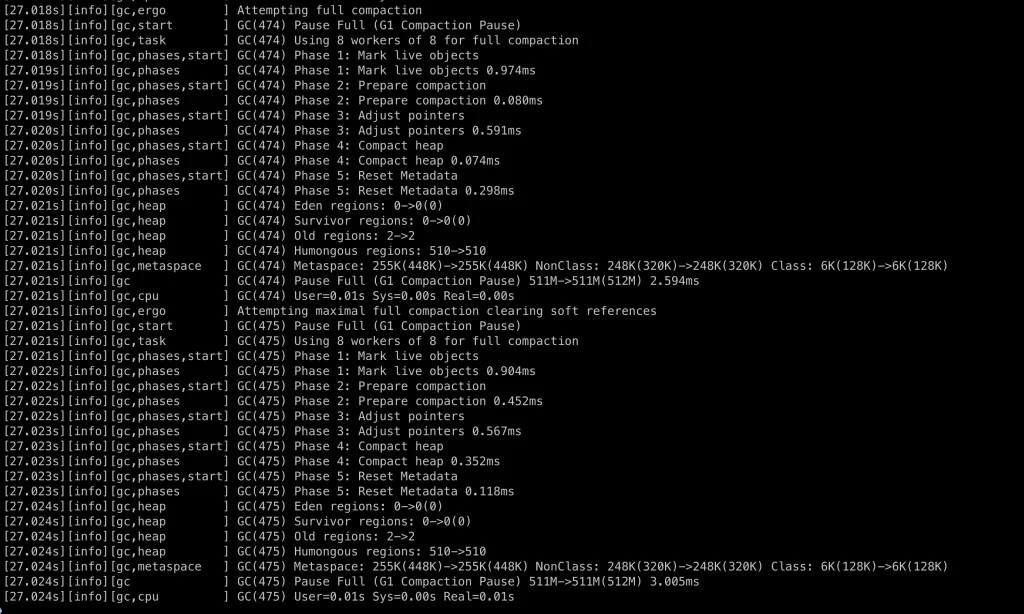
Example log line:
GC(474) Pause Full (G1 Compaction Pause) 511M->511M(512M) 2.594ms
| Field | Meaning |
|---|---|
Pause Full | Indicates a Full GC (expensive) |
511M->511M | No memory was freed (leak!) |
512M | Max heap size |
2.594ms | Pause duration |
Redirect logs for offline analysis
-Xlog:gc:file=gc.log
Step 3: Analyze Thread Dumps
What’s a thread dump?
A snapshot of all JVM threads, their states, and call stacks. Critical for diagnosing deadlocks and app hangs.
Example: Blocked Thread
public class ThreadLockDemo {
    public static void main(String[] args) throws InterruptedException {
        final Object lock = new Object();

        Thread t1 = new Thread(() -> {
            synchronized (lock) {
                while (true) {}
            }
        });

        Thread t2 = new Thread(() -> {
            synchronized (lock) {
                System.out.println("This will never be printed");
            }
        });

        t1.start();
        Thread.sleep(500);
        t2.start();
    }
}
Get a Thread Dump
jps           # find Java process ID
jstack <PID>  # print thread dump
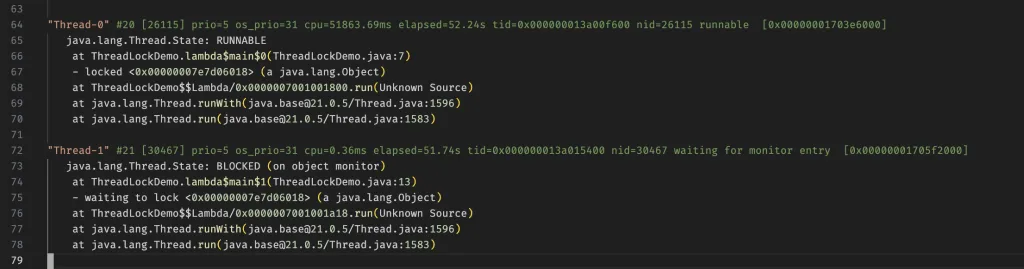
Look for:
Thread-0inRUNNABLE(holding lock)Thread-1inBLOCKED(waiting for lock)
Here is the actual thread dump of the program:
Step 4: Profile with Java Flight Recorder (JFR)
What is JFR?
A low-overhead profiler built into the JVM. It tracks memory allocations, CPU usage, GC activity, thread contention, and more.
Start JFR Recording
java -XX:+UnlockCommercialFeatures \
     -XX:+FlightRecorder \
     -XX:StartFlightRecording=duration=60s,filename=app.jfr \
     MemoryLeakDemo
Or use jcmd on a running process:
jcmd <pid> JFR.start duration=60s filename=app.jfr
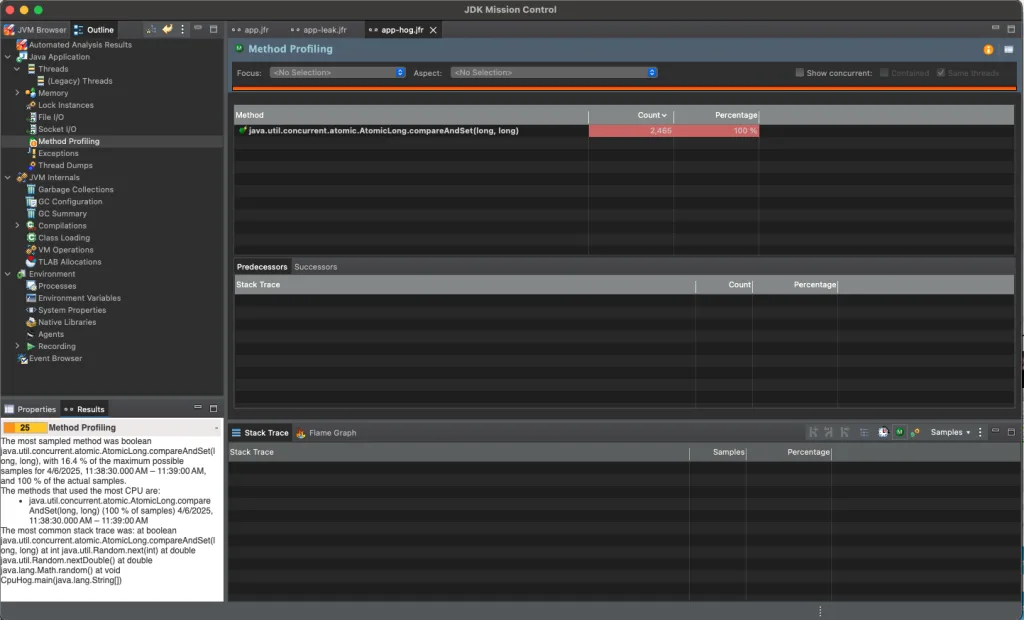
Analyze in Java Mission Control (JMC)
- Download: jdk.java.net/jmc
- Open
app.jfr - Look at:
- Memory allocation by class
- GC pause times
- CPU usage (hot methods)
- Thread contention (locks)
Simulate High CPU Usage
public class CpuHog {
    public static void main(String[] args) {
        while (true) {
            Math.pow(Math.random(), Math.random());
        }
    }
}
Profile it with JFR or VisualVM and:
- Spot hot methods
- Insert
Thread.sleep(1);to reduce CPU load

I build softwares that solve problems. I also love writing/documenting things I learn/want to learn.