Table of Contents
Overview
In this quick tutorial, I will show you how to configure Spring logging to Elasticsearch so you can search, visualize and do many useful things with your log. Things that you cannot do by looking at the console output.
Let’s get started.
Create ELK stack using Docker Compose
If you don’t have Elasticsearch running already, you can use the following file to create a running ELK stack on your docker environment in just a few minutes:
version: '3'

services:
  elasticsearch:
    image: docker.elastic.co/elasticsearch/elasticsearch:7.9.3
    container_name: elasticsearch
    environment:
      - node.name=elasticsearch
      - cluster.name=elasticsearch-cluster
      - discovery.seed_hosts=elasticsearch
      - cluster.initial_master_nodes=elasticsearch
      - bootstrap.memory_lock=true
      - "ES_JAVA_OPTS=-Xms512m -Xmx512m"
    ulimits:
      memlock:
        soft: -1
        hard: -1
    volumes:
      - ./data/elasticsearch:/usr/share/elasticsearch/data
    ports:
      - 9200:9200

  kibana:
    image: docker.elastic.co/kibana/kibana:7.9.3
    container_name: kibana
    environment:
      - ELASTICSEARCH_URL=http://elasticsearch:9200
      - ELASTICSEARCH_HOSTS=http://elasticsearch:9200
    volumes:
      - ./data/kibana:/usr/share/kibana/data
    ports:
      - 5601:5601
    depends_on:
      - elasticsearch

  logstash:
    image: docker.elastic.co/logstash/logstash:7.9.3
    container_name: logstash
    volumes:
      - ./data/logstash:/usr/share/logstash/data
    ports:
      - 9600:9600
    environment:
      - ELASTICSEARCH_URL=http://elasticsearch:9200
    depends_on:
      - elasticsearch
This starts Elasticsearch, Kibana, and Logstash on the default ports. If you have ports conflict, change to different ones.
Now the ELK stack is ready, let’s create a Spring Boot application and configure it to log into Elasticsearch.
Create an index to store logging messages on Elasticsearch
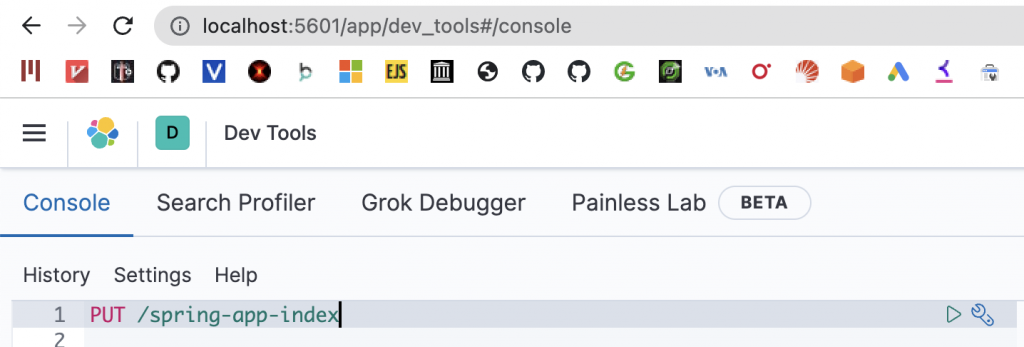
To store your logs on Elasticsearch, you need to create an index first. There are various ways to accomplish this task. However, I prefer to use Kibana because it’s visual.
Head to your Kibana URL (if you follow my setup, the URL should be http://localhost:5601/app/dev_tools#/console) and execute the following request to create an index named spring-app-index:
Configure Spring logging to Elasticsearch
Here is the pom file of the Spring boot application:
<?xml version="1.0" encoding="UTF-8"?>
<project xmlns="http://maven.apache.org/POM/4.0.0" xmlns:xsi="http://www.w3.org/2001/XMLSchema-instance"
         xsi:schemaLocation="http://maven.apache.org/POM/4.0.0 https://maven.apache.org/xsd/maven-4.0.0.xsd">
    <modelVersion>4.0.0</modelVersion>
    <parent>
        <groupId>org.springframework.boot</groupId>
        <artifactId>spring-boot-starter-parent</artifactId>
        <version>3.0.0</version>
        <relativePath/> <!-- lookup parent from repository -->
    </parent>
    <groupId>com.datmt.spring</groupId>
    <artifactId>spring-logging-elasticsearch</artifactId>
    <version>0.0.1-SNAPSHOT</version>
    <name>spring-logging-elasticsearch</name>
    <description>spring-logging-elasticsearch</description>
    <properties>
        <java.version>11</java.version>
    </properties>
    <dependencies>

        <dependency>
            <groupId>org.springframework.boot</groupId>
            <artifactId>spring-boot-starter-web</artifactId>
            <exclusions>
                <exclusion>
                    <groupId>org.springframework.boot</groupId>
                    <artifactId>spring-boot-starter-logging</artifactId>
                </exclusion>
            </exclusions>
        </dependency>

        <dependency>
            <groupId>org.springframework.boot</groupId>
            <artifactId>spring-boot-starter-log4j2</artifactId>
        </dependency>
        <dependency>
            <groupId>org.appenders.log4j</groupId>
            <artifactId>log4j2-elasticsearch-jest</artifactId>
            <version>1.6.1</version>
        </dependency>
        <dependency>
            <groupId>org.springframework.boot</groupId>
            <artifactId>spring-boot-starter-test</artifactId>
            <scope>test</scope>
        </dependency>
    </dependencies>

    <build>
        <plugins>
            <plugin>
                <groupId>org.springframework.boot</groupId>
                <artifactId>spring-boot-maven-plugin</artifactId>
            </plugin>
        </plugins>
    </build>

</project>
There are some interesting points in this file:
- Line 21 to 30 exclude the default logging dependency of Spring (which is Logback).
- Line 32 to 35 add log4j2 as the logging framework for this app
- Line 36 to 40 is the meat of this application. It’s a library that helps you write log to Elasticsearch.
The next step is to configure logging in log4j2.
Configure log4j2.xml
Create a file named log4j2.xml in the src/main/resources directory with the following content:
<?xml version="1.0" encoding="UTF-8"?>
<Configuration status="warn" name="MyApp" packages="">
    <Appenders>
        <Console name="Console" target="SYSTEM_OUT">
            <PatternLayout pattern="%d{HH:mm:ss.SSS} [%t] %-5level %logger{36} - %msg%n"/>
        </Console>
        <Elasticsearch name="Elasticsearch">
            <IndexName indexName="spring-app-index" />
            <JacksonJsonLayout />
            <AsyncBatchDelivery>
                <IndexTemplate name="spring-app-index" path="classpath:indexTemplate.json" />
                <JestHttp serverUris="http://localhost:9200" />
            </AsyncBatchDelivery>
        </Elasticsearch>
    </Appenders>
    <Loggers>
        <Root level="info">
            <AppenderRef ref="Console"/>
            <AppenderRef ref="Elasticsearch"/>
        </Root>
    </Loggers>
</Configuration>
Some important things you need to know about this file:
- On line 8, you need to put the name of the index (created earlier in this post)
- On line 11, the path option points to a file name
indexTemplate.json(also inside the resources folder). You can use this file to configure the mapping between the log messages and fields inside the index - On line 12, this points to the address of your Elasticsearch instance.
As mentioned, here is the content of indexTemplate.json
{
  "index_patterns": [
    "spring-app-index-*"
  ],
  "template": {
    "mappings": {
      "properties": {
        "loggerName": {
          "type": "keyword",
          "index": false
        },
        "message": {
          "type": "keyword",
          "index": true
        },
        "timeMillis": {
          "type": "date",
          "format": "epoch_millis"
        },
        "thread": {
          "type": "keyword",
          "index": false
        },
        "level": {
          "type": "keyword",
          "index": false
        }
      }
    }
  }
}
Write log and view logs in Kibana
Now let’s add some simple logging messages to the application.
@SpringBootApplication
public class SpringLoggingElasticsearchApplication {

    public static void main(String[] args) {
        Logger logger = LoggerFactory.getLogger(SpringLoggingElasticsearchApplication.class);

        SpringApplication.run(SpringLoggingElasticsearchApplication.class, args);
        logger.info("Starting application");
    }
}
Let’s run the app.
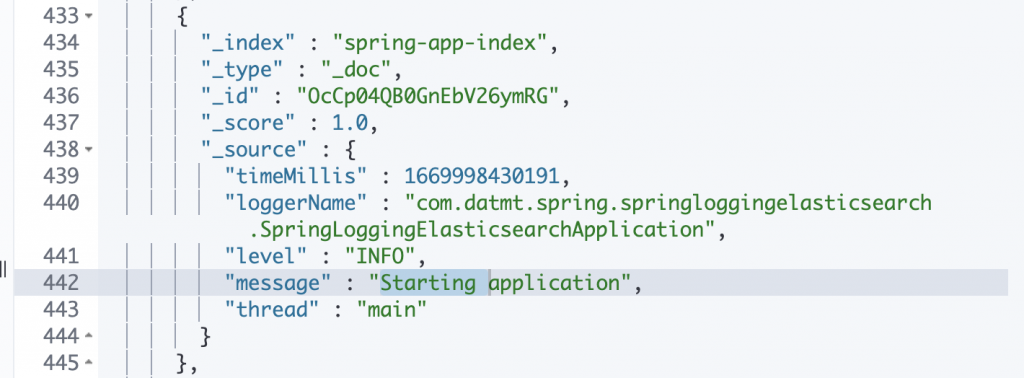
Now, if you execute the following query in Kibana, you should see the log message appear:
GET /spring-app-index/_search?size=100
{
  "query": {
    "match_all": {}
  }
}
Conclusion
This post shows you how to quickly set up Spring logging to Elasticsearch and view the messages in Kibana. There could be many other tweaks you need to do to suit your application needs but this would give you a quick start.
As usual, the code is available on GitHub.

I build softwares that solve problems. I also love writing/documenting things I learn/want to learn.